What is the rich people’s investment strategy?
The nutshell of investment is how fast doubled your money and, what was the initial investment? A rich Guy before making any investment looks at
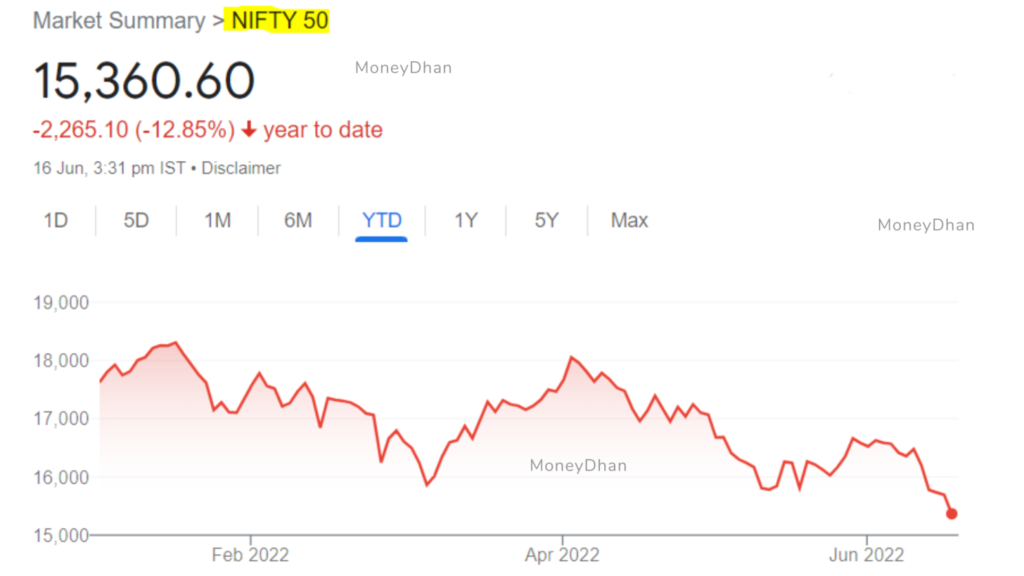
The Nifty has built up the largest net long positions in futures, as of 10 June. These positions are the largest since the March 2020 covid lockdown.
The current market price action is influenced by several factors, including the US Fed rate hikes, the taper tantrums, and inflation fears.
Of course not. Amid covid, central banks increased the money supply in the market. ( They printed alot) As anyones guess, this printing of new money leads to increase in inflation .
Based on definitions in macroeconomics books, a rising interest rate will cause a decrease in the money supply. Money will be more costly to acquire.
Yes. In 2013. The Asset Taper (FED rate hike) were on similar line. Fed initiated “taper tantrum” back in 2013.
QE: Quantitative easing was done due to 2008 financial crisis. Similarly, QE by printing more money occurred during Covid lockdown. Check the pic below.
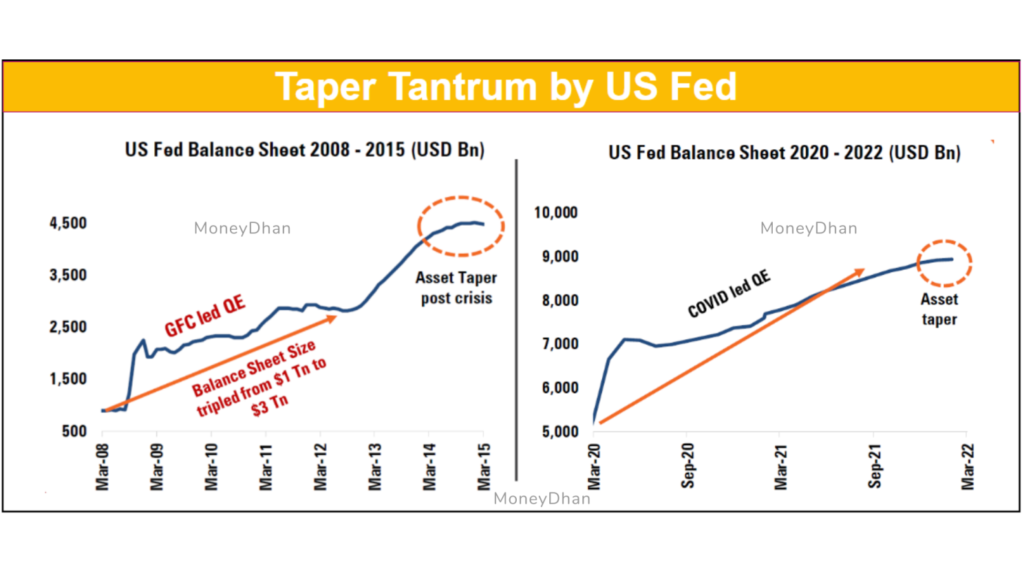
FED started to raise interest rates in 2015. This time its 2022.
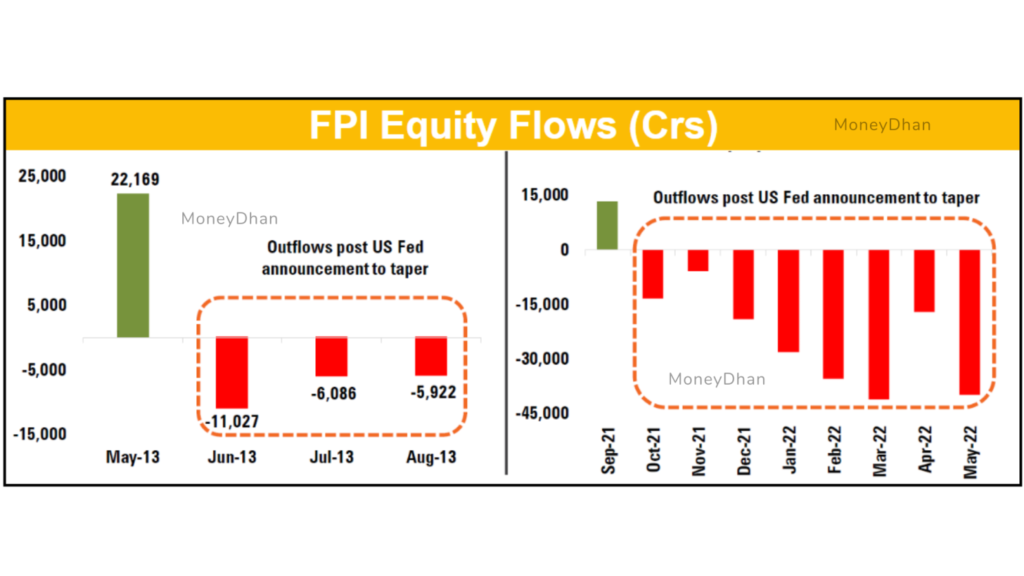
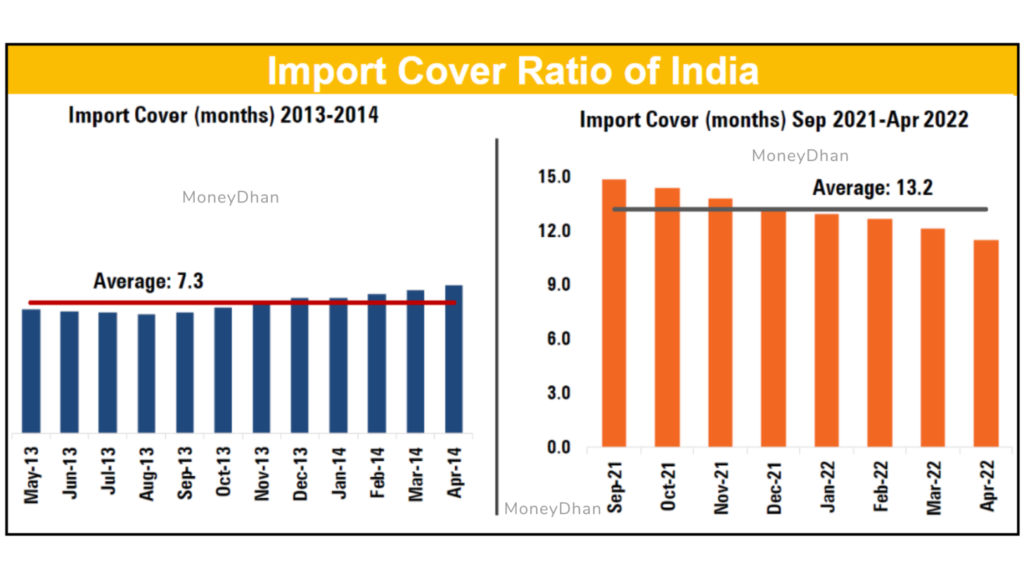
The fundamentals of India have improved much better than the situation of 2013 which explains why this selling pressure has not caused big harm. But the Pattern is similar.
As of Jun 3, 2022 RBI data -total forex reserves of India stood at $600B. Therefore, we are with much better import cover than 2013. Import cover stands for total no of months of import could be managed by forex reserves.
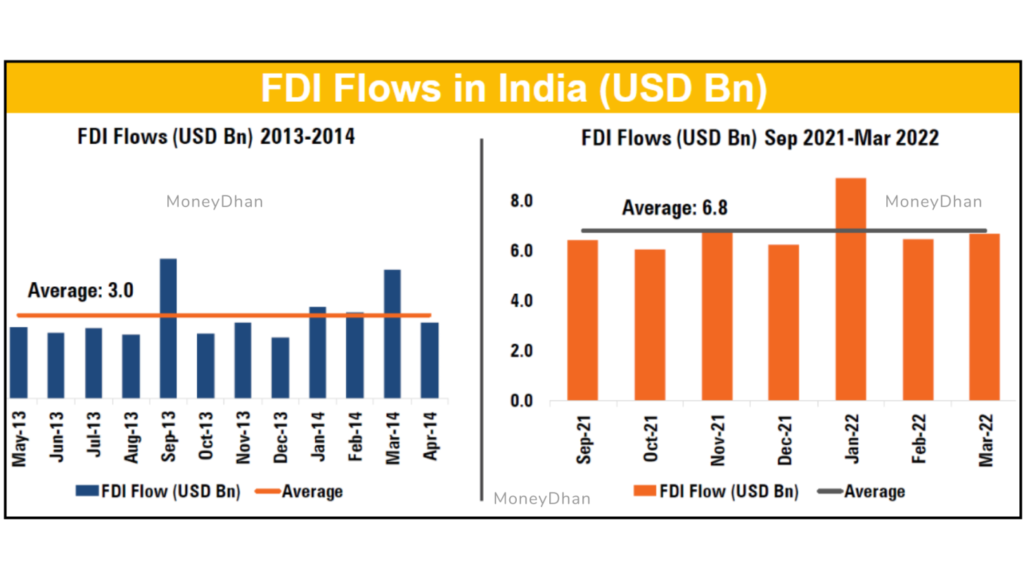
Foreign Direct Investments (FDI) flows are considered as a stable source of economy.
Compared to 2013, their levels are close to double due to the current economic conditions.
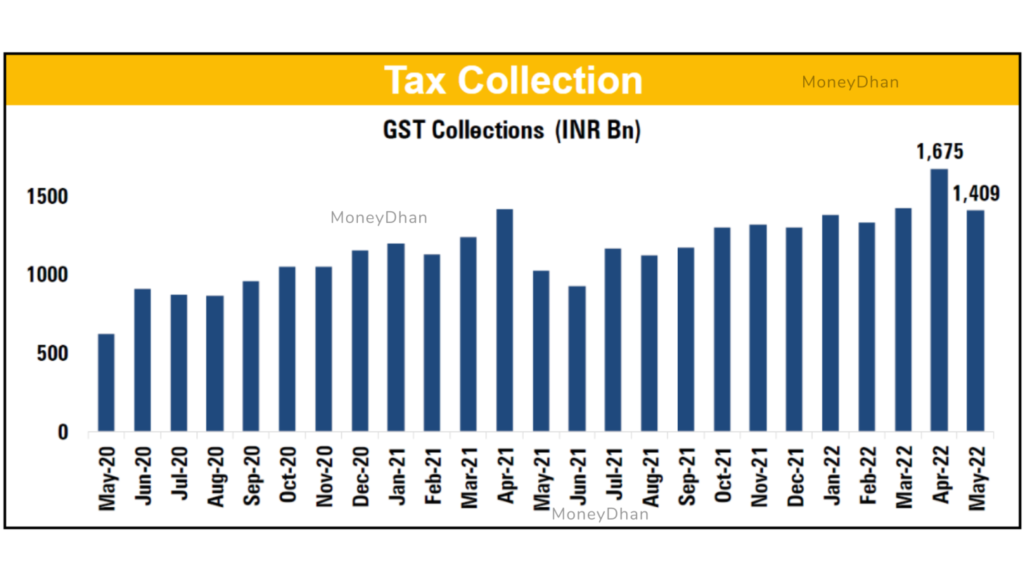
We are also backed with robust tax collections. On Apr 22, recorded the highest GST collection of 1600 (INR Bn).
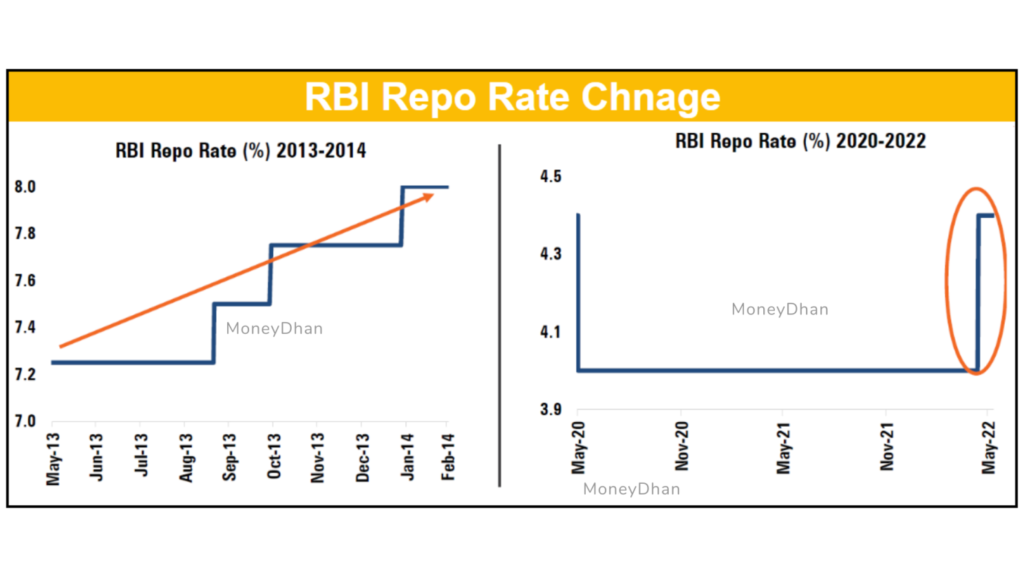
Increases in interest rates are necessary to combat rising inflation. This rate was increased three times during the 2013 events. It took less than a year for the repo rate to rise from 7.2% to 8%.
Currently, the RBI has increased the repo rate twice. It has moved from 4% to 4.9% in the past 2 months. Given the past nature of RBI, it makes sense that we should expect more increases in the future.
In 2013 FPI selling was limited to 3 months on an average of 10,000 CRs per month. From May 2013 to Aug 2013 Nifty drawdown was by -16%. Nifty fell from 6000 to 5100 levels on 2013.
Now despite the insane selling of FPI with an average of 25,000 CRs per month. From October 2021 to June 2022 (9 months) , there has been a -17% drawdown. From a high of 18500, nifty crashed till 15300 support levels.
The fact that this big hit has been less intense can be attributed to the strong economic growth and the contribution of domestic players, such as institutions and rapidly increasing retail investors.
In order to see 18500 levels again in near term, FPI must buy again. This can be seen as an accumulation phase for good blue-chip stocks until then.
For that you will need professional guidance you will need professional advice We are SEBI registered Investment Advisors. We asks for 10% profit share. You’ll pay 10 thousand only if you see 1 lakh profit, that too after a year. As per SEBI rule, our fee is never above 1.25 lakh per year ( you must earn 12 lakh profit for this fee)

Btech in Information Technology followed by an PG in Financial engineering & Risk Management from National Institute of Securities Markets. Certified Investment Advisor XB, FRM (USGARP) .

The nutshell of investment is how fast doubled your money and, what was the initial investment? A rich Guy before making any investment looks at

Introduction Let me give it straight to you. Today is October 2022. Wipro is 40% down from its all time high. I am going to

Inflation going up forces banks to raise interest rates. Higher interest rates causes bond prices to fall.But inflation was never an issue since past 30

It is not hidden from anyone that the IT sector is one of the most crucial sectors of the Indian industry as well as one
Post expense ratio and churning, Mutual Fund cannot achieve your financial goal.
60% of entire Mutual Fund Industry money is invested in just top 9 Nifty stocks. 10% goes to HDFC twins.
MF Direct Plan against expensive regular way
We are Zero Fixed fee. Buying Direct equity is close to zero cost nowadays. You can mimic MF via equity, for free.
50 Lakhs to Portfolio Management Service (PMS)
No minimum Balance with us. We can mimic the best PMS in market.
Giving Power of Attorney (POA) to anyone
Execute Yourself. We just provide you with advise and guidelines. No POA involved.
Every person is different. Let us not dis-respect your hard earned money with senseless automation.
We personalise our service for you.
We guide you via email. You can get the investment executed form your broker.
We do not touch your capital.


Moneydhan Investment Advisory India LLP
SEBI Registered Investment Advisers Registration No. INA200016193 (Type of Registration- Non-Individual, Validity of Registration- Perpetual)
7/433, Alumavunchodu, Thankalam, kothamangalam, kochi, Ernakulam, KERALA, INDIA – 686691
Contact No: 91 8480005564,
Email: sujith@moneydhan.com
Principal Officer: Mr. Hardeep Shantaram Korde, Contact No: 91 8480005564, Email: moneydhanadvisor@gmail.com
Warning: Investments in the securities market are subjected to market risks. Read all the related documents carefully before investing.
Disclaimer: Registration granted by SEBI, membership of BASL (in case of IAs) and certification from NISM in no way guarantee performance of the intermediary or provide any assurance of returns to investors. The securities quoted are for illustration only and are not recommendatory.
